1
Please refer to important disclosures at the end of this report
1
1
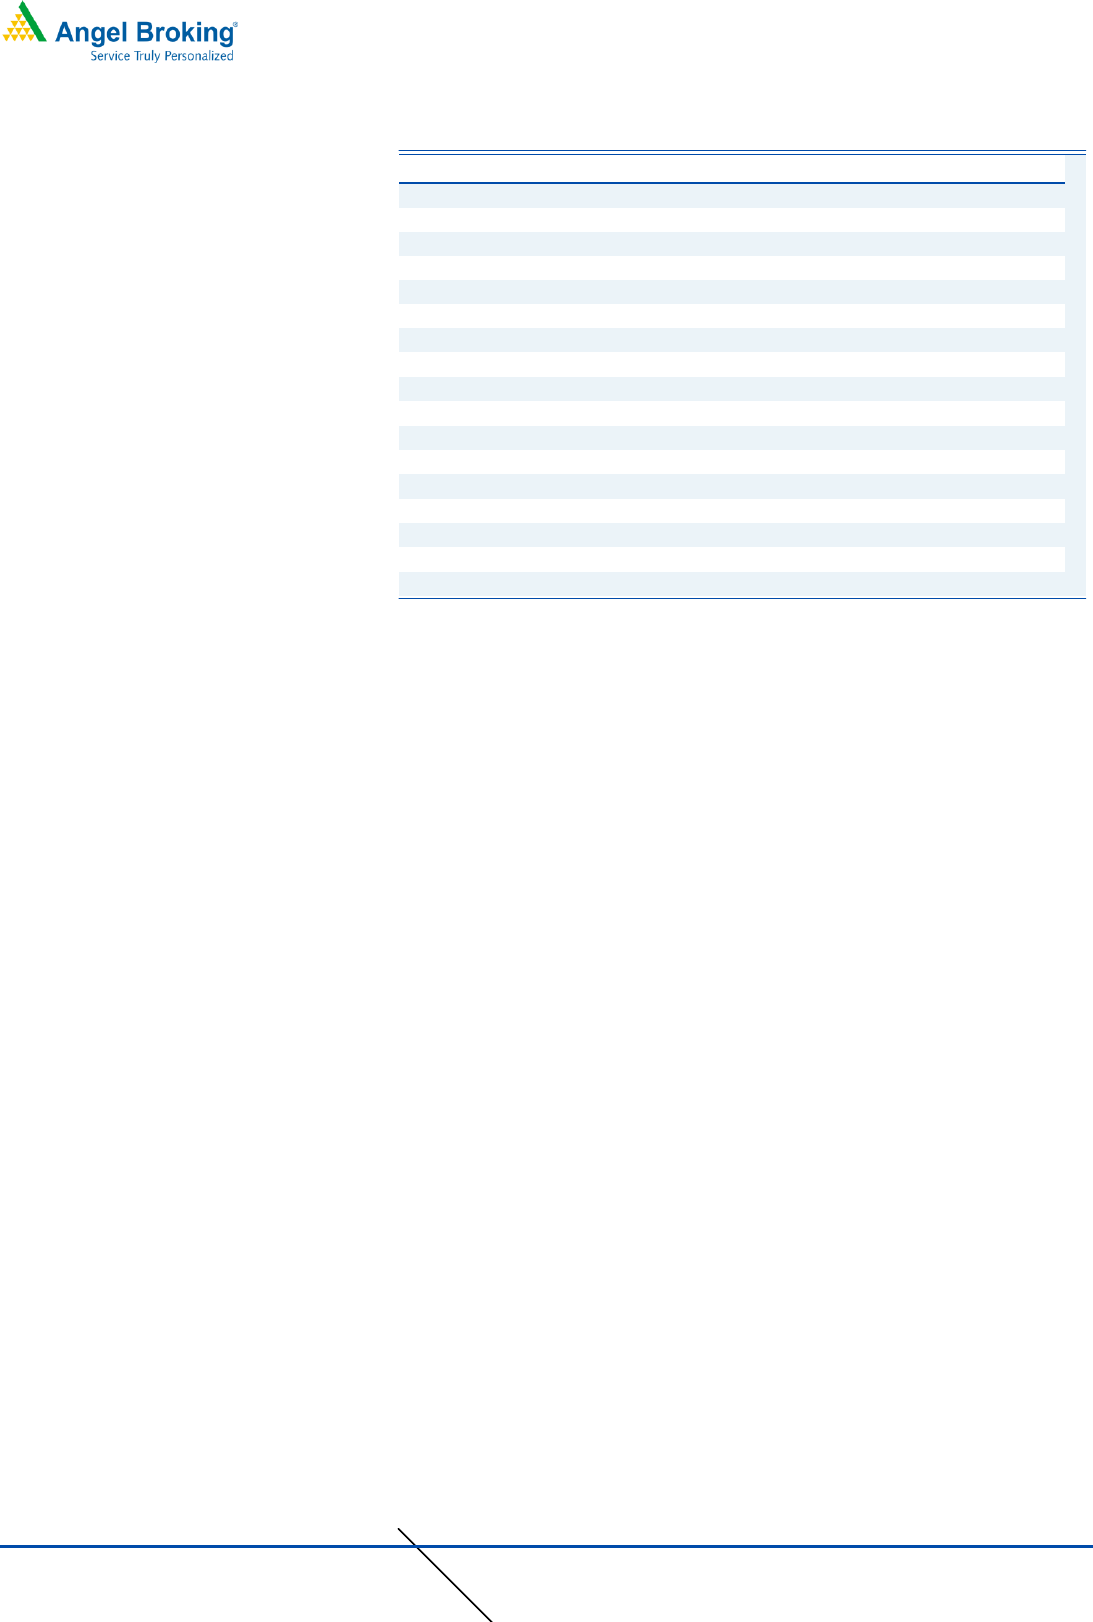
Y/E March (` cr)
2QFY20
2QFY19
% yoy
1QFY20
% qoq
Net sales
63
80
(22.0)
70
(10.4)
EBITDA
19
27
(30.3)
22
(17.3)
EBITDA margin (%)
29.6
33.1
(354bp)
32.1
(246bp)
Adjusted PAT
19
13
38.3
8
119.6
Source: Company, Angel Research
For 2QFY2020, Music Broadcast Limited (MBL) posted below expectation results
both on top-line and bottom-line fronts. MBL’s top-line registered a decline of
~22% yoy to `63cr on the back of lower ad spends. Moreover, the company’s
operating margins contracted by 354bps yoy. On the bottom-line front, MBL
reported growth of ~38% yoy to `19cr on the back of tax reversal.
Top-line de-grew ~22% yoy: MBL’s top-line de-grew by ~22% yoy to `63cr due
to lower ad spends. The revenue declined across segments like Privates (de-grew
~7%), Government + Political (de-grew ~58%) and Radio led events (de-grew
~67). Going forward, management expects 2HFY2020 would remain flat.
PAT grew ~38%: On the operating front, the company reported contraction in
margins, down 354bps yoy at 29.6%. Operating margin was impacted mainly
due to lower sales. On the bottom-line front, MBL reported de-growth of ~38%
yoy to `19cr.
Outlook and Valuation: Management expects that the company would be
able to recover the volume growth in coming financial year. Further,
considering sustainable growth opportunities over the next 5-7 years, most of
the capex is already through and given the company's strong parentage, we
have a positive outlook on MBL. However, during the quarter, the company’s
volume growth has remained subdued mainly due to overall slowdown in
economy, which affected overall ad spends. Thus, we maintain our Hold
recommendation on MBL.
Key Financials
Y/E March (` cr)
FY2018
FY2019
FY2020E
FY2021E
Net sales
298
325
341
373
% chg
9.9
8.9
4.9
9.5
Adj. Net profit
52
62
58
65
% chg
45.4
19.2
(5.6)
12.5
EBITDA margin (%)
32.6
34.9
34.0
34.5
EPS (`)
1.8
2.2
2.1
2.3
P/E (x)
25.7
21.5
22.8
20.3
P/BV (x)
2.2
2.0
1.9
1.8
RoE (%)
8.6
9.5
8.4
8.7
RoCE (%)
10.9
12.9
11.8
12.4
EV/EBITDA (x)
11.0
9.4
9.2
7.7
Source: Company, Angel Research Note
Hold
CMP `30
Target Price `45
Investment Period 12 month
Stock Info
Sector
Media
Market Cap (` cr)
1279
Net Debt (` cr)
(37,534)
Beta
0.3
52 Week High / Low
68/45
Avg. Daily Volume
5,838
Face Value (`)
10
BSE Sensex
37,767
Nifty
11,203
Reuters Code
-
Bloomberg Code
RADIOCIT.IN
Shareholding Pattern (%)
Promoters
73.7
MF / Banks / Indian Fls
10.1
FII / NRIs / OCBs
14.7
Indian Public / Others
1.6
Abs. (%)
3m
1yr
3yr
Sensex
(3.4)
0.5
34.3
MSIL
(20.9)
(22.8)
-
Historical share price chart
Source: Company, Angel Research
Research Analyst
Amarjeet S Maurya
022-40003600 Ext: 6831
0
10
20
30
40
50
60
70
80
90
100
Mar-17
May-17
Jul-17
Sep-17
Nov-17
Jan-18
Mar-18
May-18
Jul-18
Sep-18
Nov-18
Jan-19
Mar-19
May-19
Jul-19
Music Broadcast
Performance Update
2QFY2020 Result Update | Media
December 9, 2019
2
Music Broadcast Ltd| 2QFY2020 Result Update
December 9, 2019
2
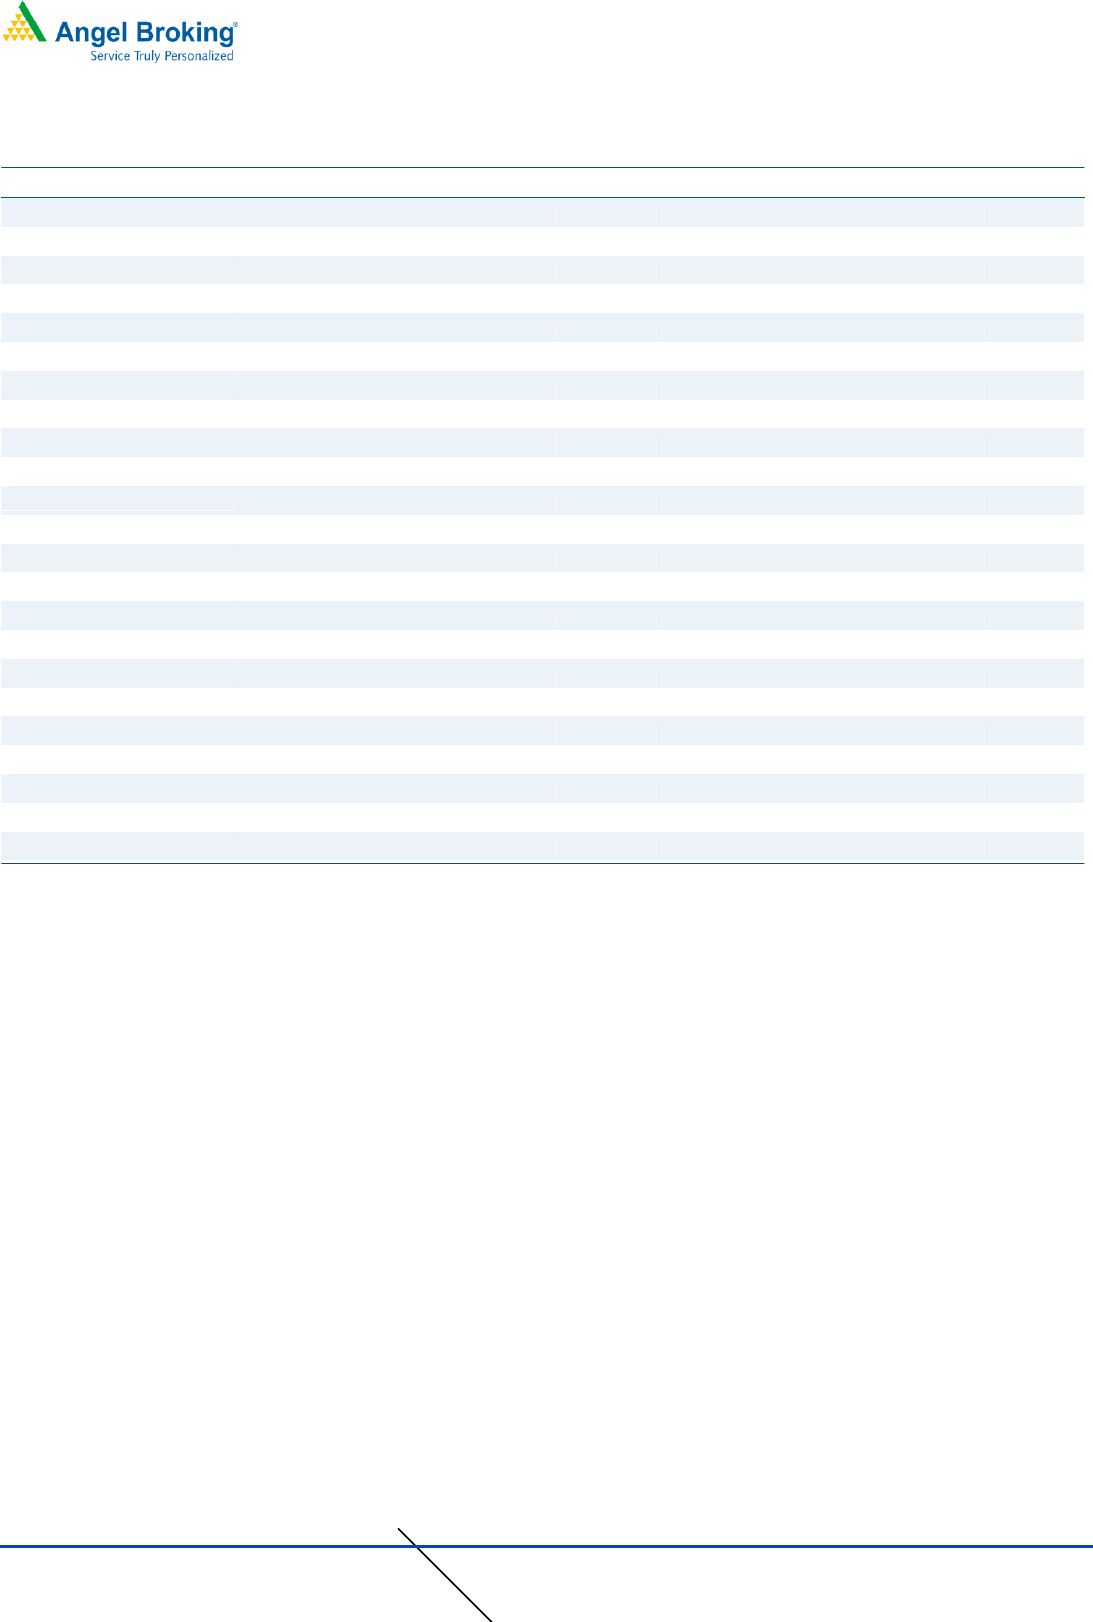
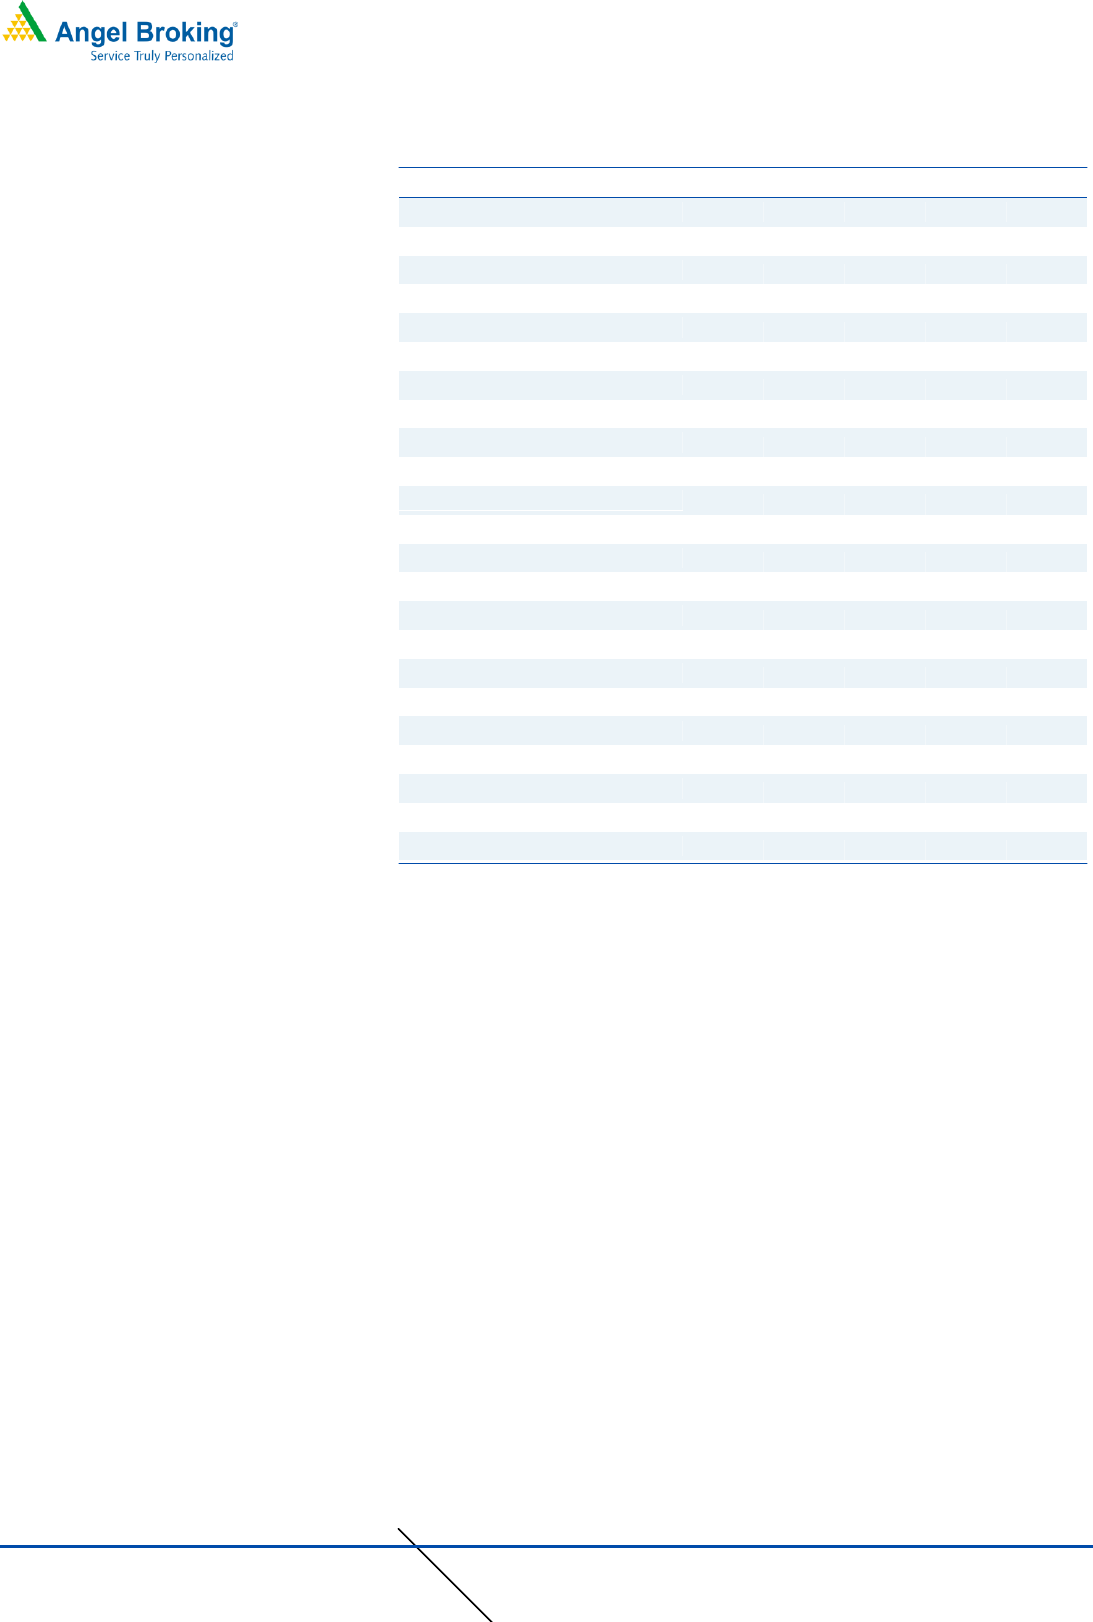
Exhibit 1: 2QFY2020 Performance
Y/E March (` cr)
2QFY20
2QFY19
% yoy
1QFY20
% qoq
1HFY20
1HFY19
% chg
Net Sales
63
80
(22.0)
70
(10.4)
132
156
(15.1)
Staff Costs
12
18
(32.8)
16
(25.6)
28
36
(21.5)
(% of Sales)
19.2
22.3
23.2
21.3
23.0
Other Expenses
32
36
(10.3)
31
2.4
63
67
(6.0)
(% of Sales)
51.2
44.5
44.8
47.8
43.2
Total Expenditure
44
54
(17.8)
47
(7.2)
91
103
(11.4)
Operating Profit
19
27
(30.3)
22
(17.3)
41
53
(22.3)
OPM
29.6
33.1
32.1
30.9
33.8
Interest
3
1
92.0
3
3.1
5
3
89.1
Depreciation
9
7
29.4
9
0.9
17
13
28.4
Other Income
5
4
38.6
3
51.7
8
6
37.5
PBT (excl. Ext Items)
12
22
(44.8)
15
(16.0)
27
42
(37.1)
Ext (Income)/Expense
-
-
-
-
-
PBT (incl. Ext Items)
12
22
(44.8)
15
(16.0)
27
42
(37.1)
(% of Sales)
19.5
27.6
20.8
20.2
27.2
Provision for Taxation
(6)
9
(172.8)
6
(204.3)
(0)
16
(101.7)
(% of PBT)
(52.0)
39.4
41.9
(1.0)
36.7
Reported PAT
19
13
38.3
8
119.6
27
27
0.2
PATM
29.6
16.7
12.1
20.4
17.3
Minority Interest After NP
Reported PAT
19
13
38.3
8
119.6
27
27
0.2
Equity shares (cr)
6
6
6
6
6
FDEPS (Rs)
3.2
2.3
38.3
1.5
119.6
4.7
4.7
0.2
Source: Company, Angel Research

3
Music Broadcast Ltd| 2QFY2020 Result Update
December 9, 2019
3
Outlook and Valuation: Management expects that the company would be able
to recover the volume growth in coming financial year. Further, considering
sustainable growth opportunities over the next 5-7 years, most of the capex is
already through and given the company's strong parentage, we have a
positive outlook on MBL. However, during the quarter, the company’s volume
growth has remained subdued mainly due to overall slowdown in economy,
which affected overall ad spends. Thus, we maintain our Hold
recommendation on MBL.
Downside risks to our estimates
Slowdown in Indian economy would impact overall ad spends: A slowdown in the
economy could affect spending from the clients, which in turn would affect the
company’s overall earnings.
Increase in content price: Inability to effectively source music content from third
party music production entities/associations can increase the input costs for the
company, and hence, may result in the dip in margins.
Reduction in listenership numbers: Rising acceptance of data and continuous
reduction in the cost of data could lead to shift of listenership to digital
platform/mobile applications (Hungama, Saavn, Gaana) and options to download
could risk the listenership in Metros and key towns initially.
Company Background
Music Broadcast Limited (MBL) owns and operates FM radio stations under the
brand names Radio City and Radio Mantra. The company has 39 radio stations
and operates its radio stations in 37 Indian cities. Radio City is present in 12 out of
the top 15 cities in India by population. Radio City has been ranked Number One
in Mumbai, Bengaluru and Delhi in terms of number of listeners and has a total
number of 49.60mn listeners across all 23 cities (according to AZ Research). Music
Broadcast Limited operates as a subsidiary of Jagran Prakashan Limited. It also
operates 40 Web radio stations that offer Internet radio with live RJ hosted shows
through Planet Radio City in 8 languages. In addition, Music Broadcast Limited
operates 'Planet Radio City' mobile app that plays various stations such as 'Radio
City Freedom', 'Radio City Electronica', 'Radio City Metal', and 'Radio City Smaran'
in various languages on mobile and other smart devices.
4
Music Broadcast Ltd| 2QFY2020 Result Update
December 9, 2019
4
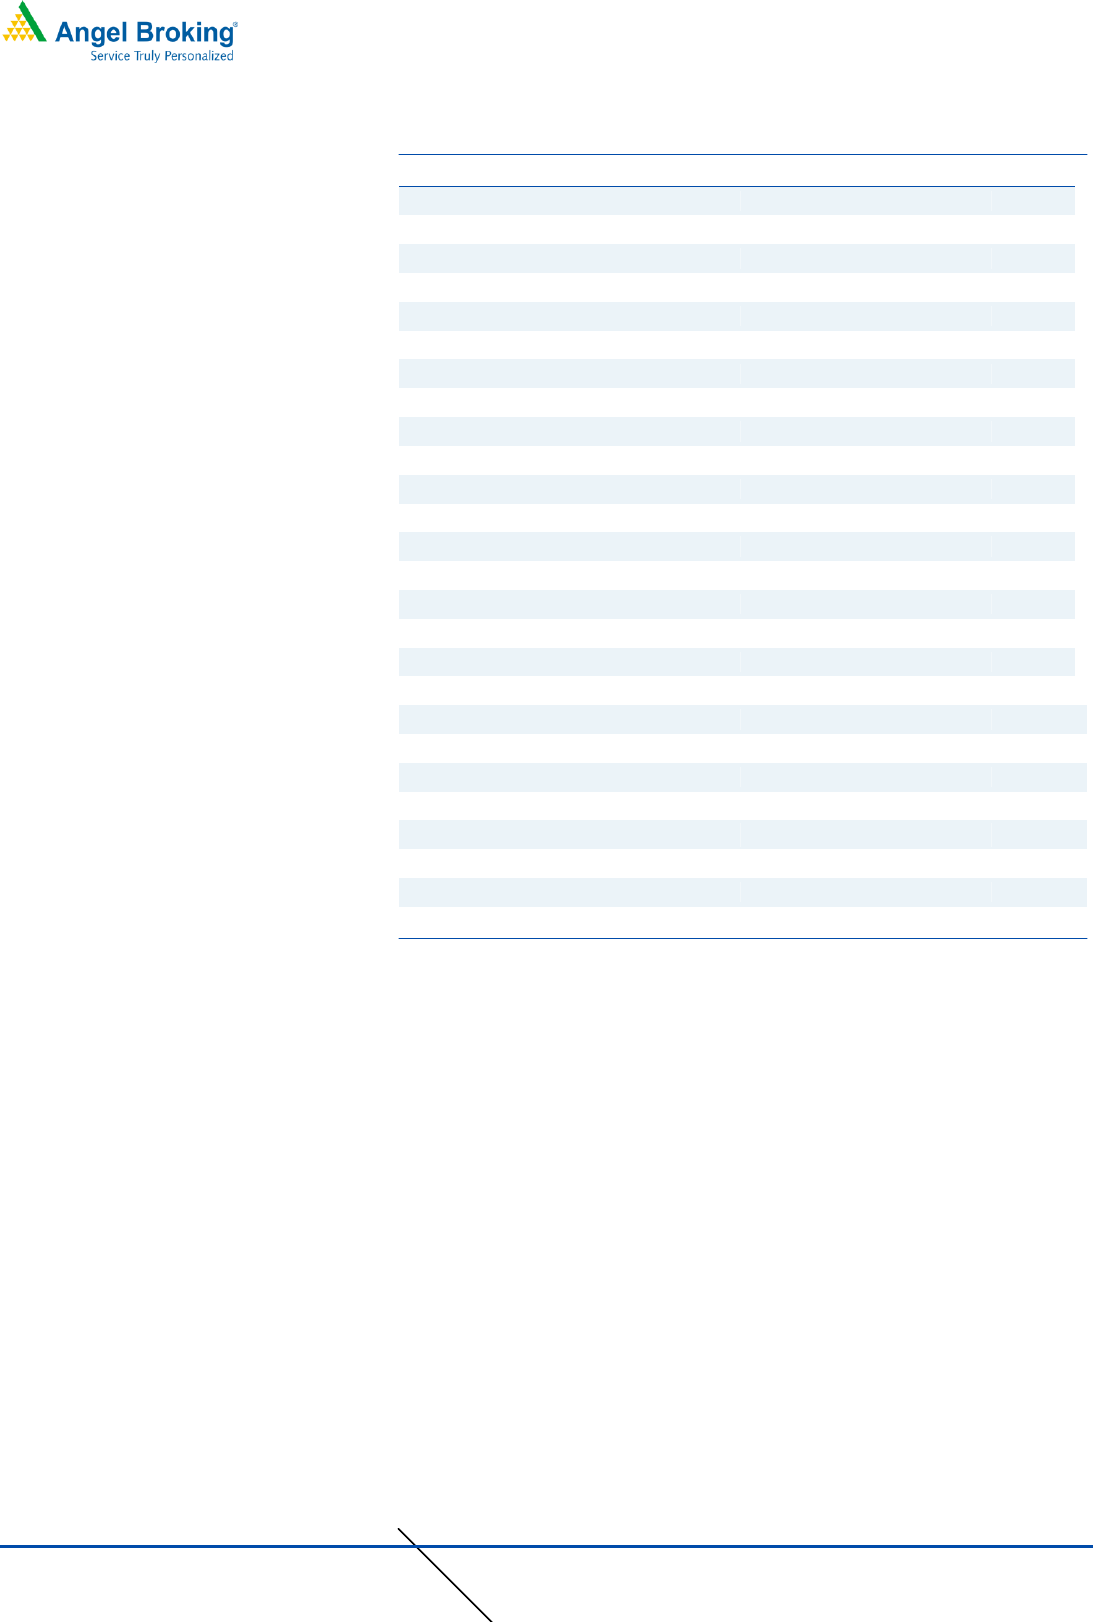
Profit & Loss Statement
Y/E March (` cr)
FY2017
FY2018
FY2019
FY2020E
FY2021E
Total operating income
271
298
325
296
325
% chg
20.4
9.9
8.9
(8.9)
10.0
Total Expenditure
180
201
212
201
215
License fees
19
21
0
0
0
Personnel
65
69
69
65
72
Others Expenses
96
111
143
136
143
EBITDA
91
97
113
95
111
% chg
16.8
6.4
16.6
(16.4)
16.9
(% of Net Sales)
33.6
32.6
34.9
32.0
34.0
Depreciation& Amortisation
20
26
27
34
36
EBIT
72
71
86
61
75
% chg
16.5
(1.1)
21.6
(29.6)
23.0
(% of Net Sales)
26.4
23.7
26.5
20.5
22.9
Interest & other Charges
19
15
6
10
10
Other Income
4
19
15
16
17
(% of PBT)
8
26
16
24
21
Extraordinary Items
1
-
-
-
-
Share in profit of Associates
Recurring PBT
57
75
96
67
82
% chg
2.7
31.9
27.1
(30.3)
22.5
Tax
20
24
34
17
21
PAT (reported)
36
52
62
50
61
% chg
30.3
45.4
19.2
(19.1)
22.5
(% of Net Sales)
13.1
17.3
19.0
16.9
18.8
Basic & Fully Diluted EPS (`)
1.3
1.8
2.2
1.8
2.2
% chg
30.3
45.4
19.2
(19.1)
22.5
5
Music Broadcast Ltd| 2QFY2020 Result Update
December 9, 2019
5
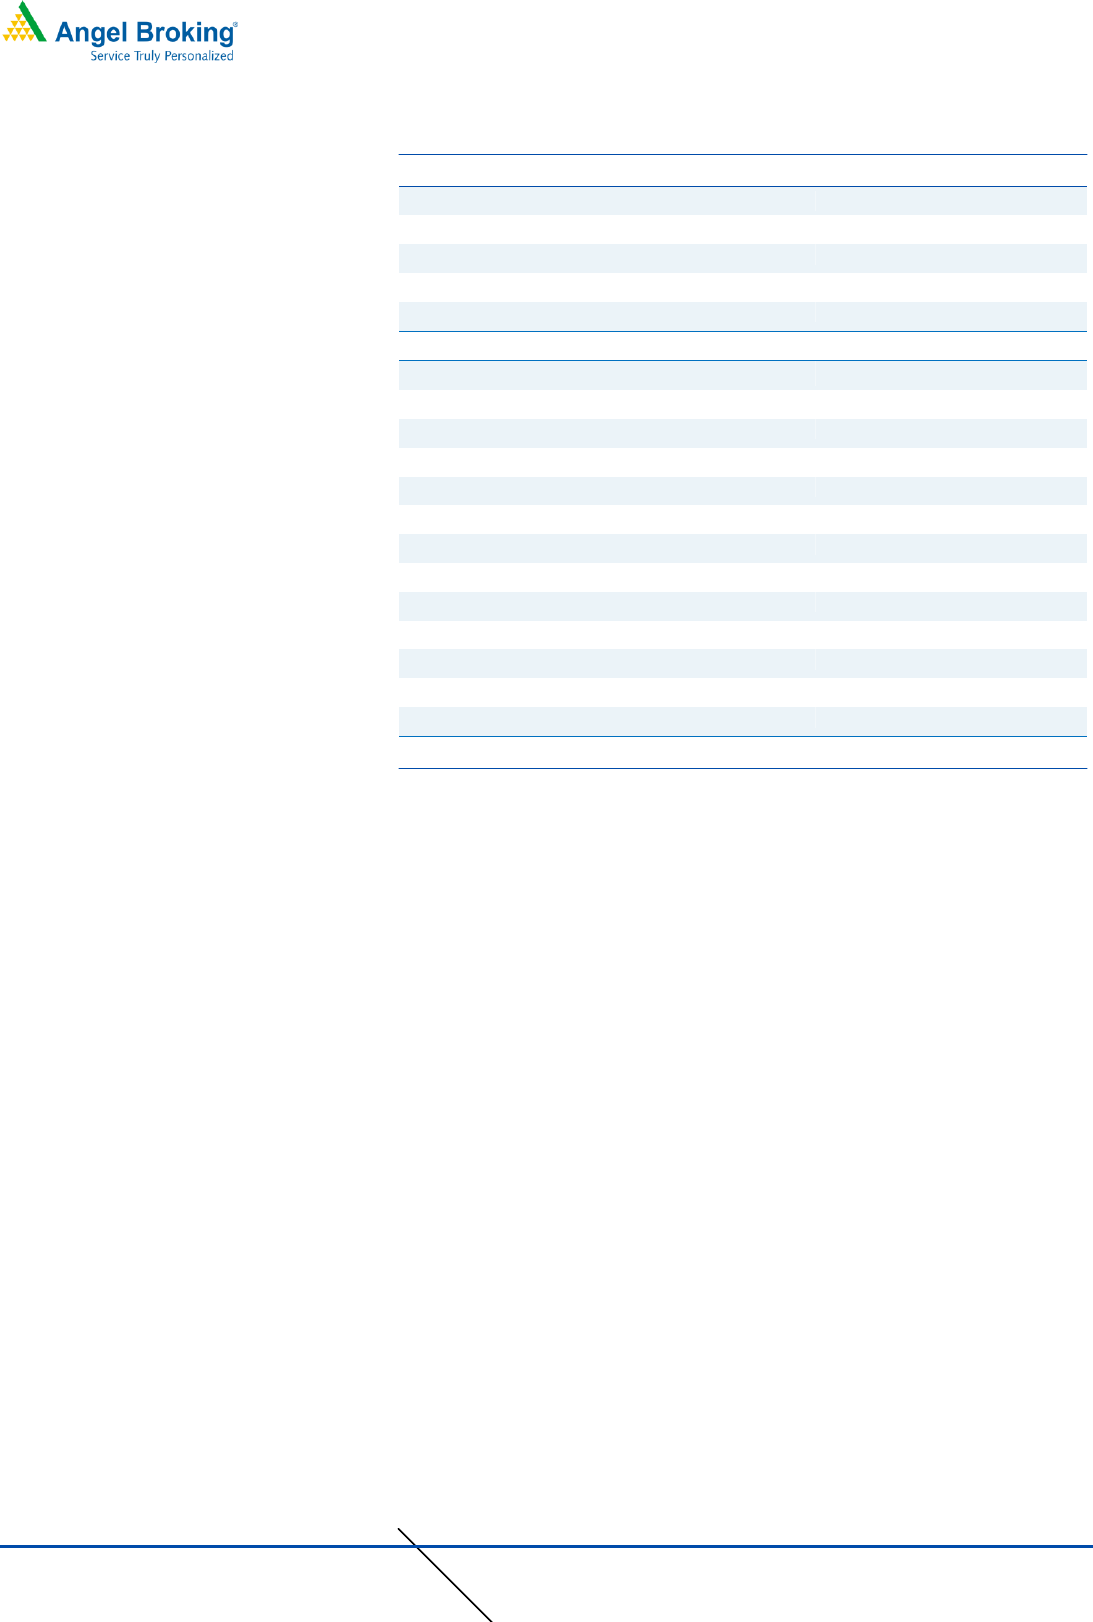
Balance Sheet
Y/E March (` cr)
FY2017
FY2018
FY2019
FY2020E
FY2021E
SOURCES OF FUNDS
Equity Share Capital
57
57
57
57
57
Reserves& Surplus
491
543
592
632
681
Shareholders Funds
548
600
649
689
738
Total Loans
155
54
19
19
19
Total Liabilities
703
653
668
708
757
APPLICATION OF FUNDS
Net Block
312
297
290
275
260
Capital Work-in-Progress
0
0
0
0
0
Investments
27
156
172
172
172
Current Assets
372
208
229
258
340
Inventories
0
0
0
0
0
Sundry Debtors
58
22
27
24
27
Cash
268
76
79
114
184
Loans & Advances
0
0
0
0
0
Other Assets
23
22
22
22
22
Current liabilities
83
45
107
67
70
Net Current Assets
290
163
121
190
340
Other Non-Current Asset
73
37
37
37
37
Total Assets
701
653
621
708
757
6
Music Broadcast Ltd| 2QFY2020 Result Update
December 9, 2019
6
Cashflow Statement
Y/E March (` cr)
FY2017
FY2018
FY2019
FY2020E
FY2021E
Profit before tax
57
75
96
67
82
Depreciation
20
26
27
34
36
Change in Working Capital
(7)
(40)
44
(33)
(10)
Interest / Dividend (Net)
17
3
6
10
10
Direct taxes paid
(9)
(16)
(34)
(17)
(21)
Others
1
(7)
-
-
-
Cash Flow from Operations
79
40
139
60
97
(Inc.)/ Dec. in Fixed Assets
(27)
(6)
(5)
(5)
(5)
(Inc.)/ Dec. in Investments
(183)
9
(16)
-
-
Cash Flow from Investing
(211)
3
(21)
(5)
(5)
Issue of Equity
(38)
-
-
-
-
Inc./(Dec.) in loans
(133)
(100)
(34)
-
-
Others
376
(16)
(18)
(20)
(22)
Cash Flow from Financing
205
(116)
(52)
(20)
(22)
Inc./(Dec.) in Cash
73
(72)
66
35
70
Opening Cash balances
13
86
13
79
114
Closing Cash balances
86
13
79
114
184
7
Music Broadcast Ltd| 2QFY2020 Result Update
December 9, 2019
7
Key Ratio
Y/E March
FY2017
FY2018
FY2019
FY2020E
FY2021E
Valuation Ratio (x)
P/E (on FDEPS)
23.8
16.4
13.7
17.0
13.9
P/CEPS
15.3
10.9
9.5
10.1
8.7
P/BV
1.5
1.4
1.3
1.2
1.1
Dividend yield (%)
0.0
0.0
1.5
1.2
1.4
EV/Sales
2.1
1.9
1.8
2.0
1.6
EV/EBITDA
6.3
5.9
5.1
6.1
4.6
EV / Total Assets
0.8
0.9
0.9
0.9
0.6
Per Share Data (Rs)
EPS (Basic)
1.3
1.8
2.2
1.8
2.2
EPS (fully diluted)
1.3
1.8
2.2
1.8
2.2
Cash EPS
2.0
2.8
3.1
3.0
3.4
DPS
0.0
0.0
0.4
0.4
0.4
Book Value
19.4
21.2
23.0
24.4
26.1
Returns (%)
ROCE
10.3
10.9
12.9
8.6
9.9
Angel ROIC (Pre-tax)
17.5
16.8
20.6
14.4
18.6
ROE
6.5
8.6
9.5
7.2
8.3
Turnover ratios (x)
Inventory / Sales (days)
-
-
-
-
-
Receivables (days)
110
135
144
150
150
Payables (days)
78
27
30
30
30
Working capital cycle (ex-cash) (days)
32
108
114
120
120

8
Music Broadcast Ltd| 2QFY2020 Result Update
December 9, 2019
8
Research Team Tel: 022 - 39357800 E-mail: research@angelbroking.com Website:
www.angelbroking.com
DISCLAIMER
Angel Broking Limited (hereinafter referred to as “Angel”) is a registered Member of National Stock Exchange of India
Limited, Bombay Stock Exchange Limited and Metropolitan Stock Exchange Limited. It is also registered as a Depository
Participant with CDSL and Portfolio Manager and Investment Adviser with SEBI. It also has registration with AMFI as a
Mutual Fund Distributor. Angel Broking Limited is a registered entity with SEBI for Research Analyst in terms of SEBI
(Research Analyst) Regulations, 2014 vide registration number INH000000164. Angel or its associates has not been
debarred/ suspended by SEBI or any other regulatory authority for accessing /dealing in securities Market. Angel or its
associates/analyst has not received any compensation / managed or co-managed public offering of securities of the
company covered by Analyst during the past twelve months.
This document is solely for the personal information of the recipient, and must not be singularly used as the basis of any
investment decision. Nothing in this document should be construed as investment or financial advice. Each recipient of
this document should make such investigations as they deem necessary to arrive at an independent evaluation of an
investment in the securities of the companies referred to in this document (including the merits and risks involved), and
should consult their own advisors to determine the merits and risks of such an investment.
Reports based on technical and derivative analysis center on studying charts of a stock's price movement, outstanding
positions and trading volume, as opposed to focusing on a company's fundamentals and, as such, may not match with a
report on a company's fundamentals. Investors are advised to refer the Fundamental and Technical Research Reports
available on our website to evaluate the contrary view, if any
The information in this document has been printed on the basis of publicly available information, internal data and other
reliable sources believed to be true, but we do not represent that it is accurate or complete and it should not be relied on
as such, as this document is for general guidance only. Angel Broking Limited or any of its affiliates/ group companies
shall not be in any way responsible for any loss or damage that may arise to any person from any inadvertent error in the
information contained in this report. Angel Broking Limited has not independently verified all the information contained
within this document. Accordingly, we cannot testify, nor make any representation or warranty, express or implied, to the
accuracy, contents or data contained within this document. While Angel Broking Limited endeavors to update on a
reasonable basis the information discussed in this material, there may be regulatory, compliance, or other reasons that
prevent us from doing so.
This document is being supplied to you solely for your information, and its contents, information or data may not be
reproduced, redistributed or passed on, directly or indirectly.
Neither Angel Broking Limited, nor its directors, employees or affiliates shall be liable for any loss or damage that may
arise from or in connection with the use of this information.
Disclosure of Interest Statement Music Broadcast
1. Financial interest of research analyst or Angel or his Associate or his relative No
2. Ownership of 1% or more of the stock by research analyst or Angel or associates or relatives No
3. Served as an officer, director or employee of the company covered under Research No
4. Broking relationship with company covered under Research No
Ratings (Returns): Buy (> 15%) Accumulate (5% to 15%) Neutral (-5 to 5%)
Reduce (-5% to -15%) Sell (< -15%)